
Demand & promotions · Growth Planning Studio
See what each discount really earns. Before you commit a dollar.
Demand forecasting and promotional planning for a portfolio of brands, with a built-in Model Card that shows every coefficient in plain sight.
Live tool · one self-contained file · yours to keep
The problem it solves
Promotions get planned on gut and last year's calendar. The bill arrives later.
Discounts shift volume you would have sold anyway, or steal it from the brand on the next shelf.
This tool forecasts demand brand by brand, from price elasticity, seasonality, competitor pricing and the cross-brand pull between your own labels. It shows the units and revenue each discount week will produce, the Promo Yield, and the spillover onto sibling brands. Then it re-times the calendar to get more volume from the same discount budget.
The decisions you walk away with: which promotions to run, how deep, and in which weeks. And which to drop, because they only buy volume you already had.
How it's different
Most promo tools are a year-long enterprise program, or a black box. This is a planner you drive.
Forecast, calendar, optimiser and yearly outcome in one self-contained file, built on your data.
It's portfolio-aware: cannibalisation across your brand family is modelled and shown, not hidden. And it's transparent: a built-in Model Card lays out every coefficient, elasticity, diagnostic and caveat, so a result can be checked, not just trusted.
In your hands
What you get.
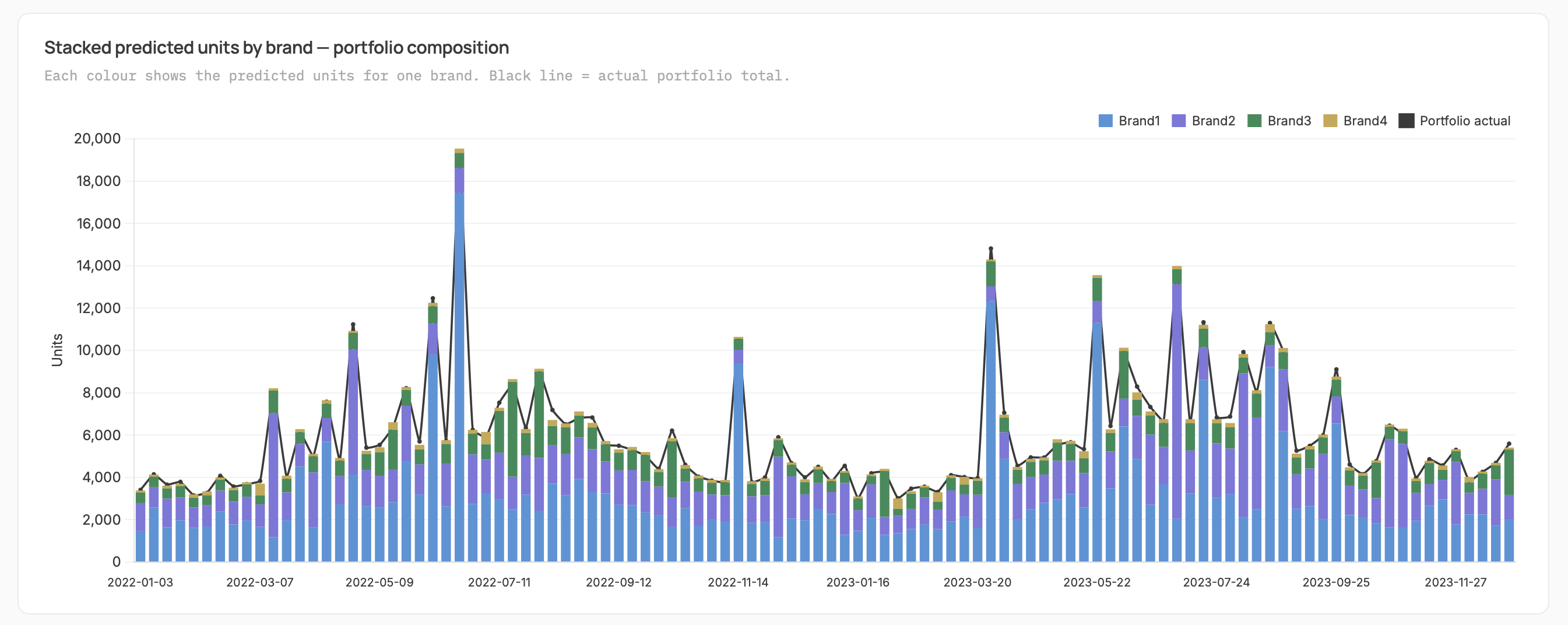
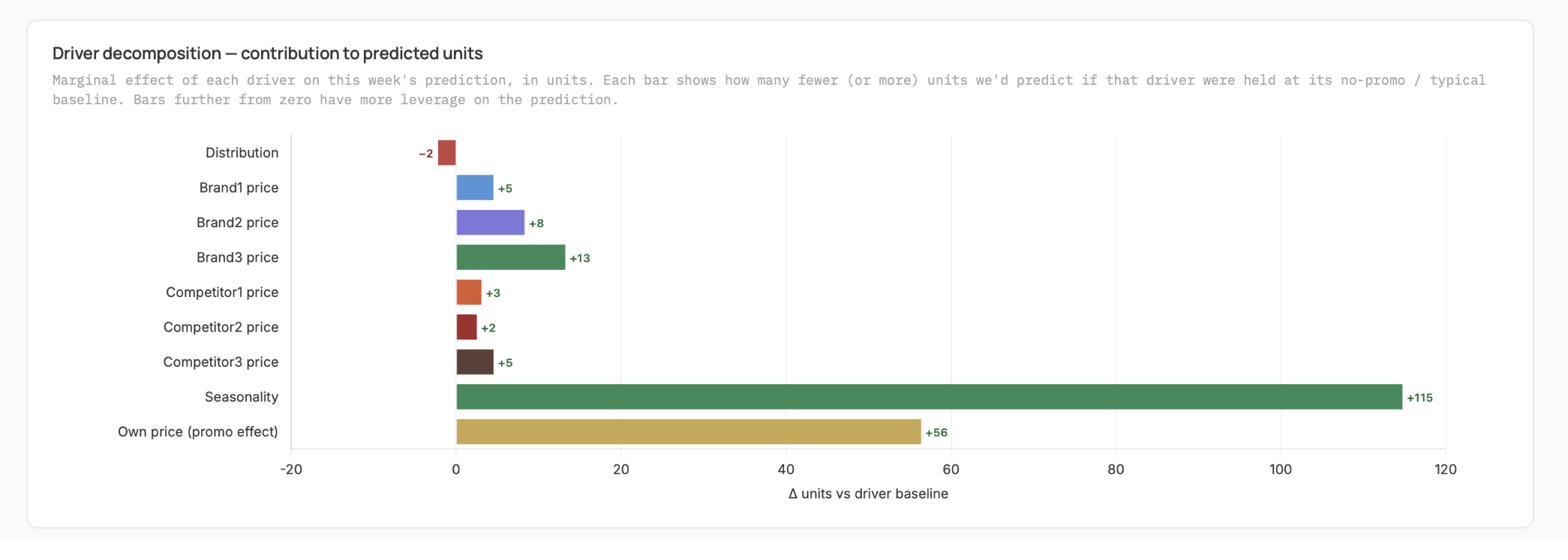
- Demand forecast and historical fitWeekly units per brand and for the portfolio, base versus promotional lift, actual-versus-predicted fit, a driver decomposition.
- Promo PlannerEdit price or discount per week; units, revenue and Promo Yield recompute live. Optimise schedule re-times your discounts to the highest-response weeks. Same depths, more volume.
- Cross-brand and competitor effectsPer-brand elasticity by discount band, cannibalisation between sibling brands, competitor substitution, and the discount-sweep curve.
- Model Card and yearly resultsEvery coefficient, elasticity and caveat in plain sight, plus year volume, revenue, quarterly contribution and saved simulations.
And the rest
One self-contained file. No login. Works in any browser, exports any chart or table to CSV or image. A walkthrough of the findings and a refreshed build when new data lands, all included.
- No login, no seat to learn
- Exports to CSV or image
- Walkthrough of the findings included
- Refreshed build when new data lands
Promo ROI, brand by brand
Every discount week carries a Promo Yield, the revenue earned per dollar of discount, and the spillover onto sibling brands is modelled rather than assumed. You see which promotions pay for themselves, and which quietly move volume from one shelf to another.
Alternatives
What it beats.
Enterprise TPM and TPO suites
Powerful, but 3 to 18 month builds wired into the supply chain, at six and seven figures.
AI price and promo platforms
Granular and real-time, but a subscription, an integration, and a recommendation you take on trust.
Spreadsheets and gut
Fast and free, but blind to elasticity, seasonality and cannibalisation across the portfolio.
Not sure if this is the one?
Eight quick questions. Within 24 hours we'll come back with the solutions worth considering and the approximate budget.